
A website called The Data Duo held a contest for the best visualization of UFO sightings data. Their data covers UFO sightings from 1960 to 2014 and reveals some interesting info.
The Data Duo’s third #DuoDare is for the best visualization of UFO sightings. The dataset includes latitude and longitude data, so they were able to produce some cool looking maps. However, there is little to be gleaned from the maps, but there are still other bits of info they obtained.
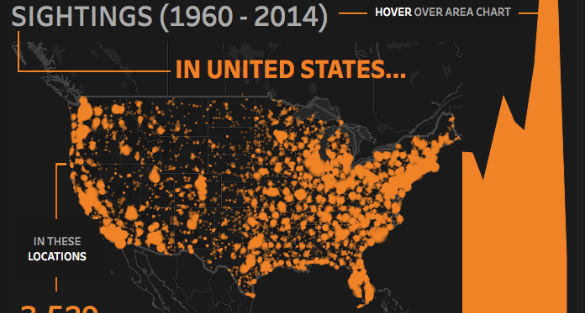
The Data Duo, Pooja Gandhi and Adam Crahen, made their best attempts at showing the data, and although I am partial to Pooja’s map, Adam is in the lead when it comes to votes. Previously, I have referred to these sorts of graphics as “infographics,” but the Data Duo refer to them as a “viz.” That is short and cooler. Here are their visualizations (vizs).


An article has popped up on Bustle about Adam’s map, and they note the areas where there are more sightings and ask some experts why there might be more sightings in these areas. However, there is a problem with this. If you look at this map and a map of the United States at night, you will see the similarities.
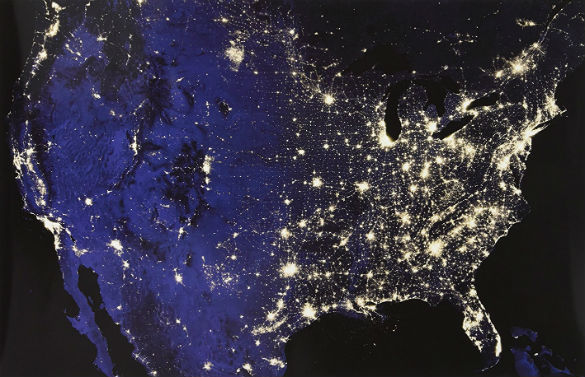
As you can see they are very similar. This is because UFO sightings are reported more frequently in areas that have more people. Which makes sense. In order to discover where there are more sightings, it is more accurate to look at the areas that have more sightings per person. I always look at the data both ways. Here is an analysis I did of UFO sightings from the year 2014.
The data used by the Data Duo is from a website called Kaggle. Kaggle provides datasets for data crunchers to analyze. The UFO data Kaggle uses is from the National UFO Reporting Center (NUFORC). NUFORC has been receiving UFO reports for years, and they were the first to post them online. NUFORC is not actually a “they.” It is ran by a man by the name of Peter Davenport in Washington. Davenport posts his information raw.
The organization I use to compile my lists, like the 2014 data above, is from the Mutual UFO Network (MUFON). They have also been collecting reports for years. They investigate their reports to determine their validity. They find the vast majority to be explainable. MUFON did not get their data online until much later than NUFOC, and getting their data is difficult. In fact, I used to have access to more of it, but now I just have a monthly report they send out. Now that I think of it, I am not sure they even send that out anymore. This is why many media outlets use Davenport’s information. There is also a book out titled UFO Sightings Desk Reference: United States of America 2001-2015 that analyzes MUFON data.
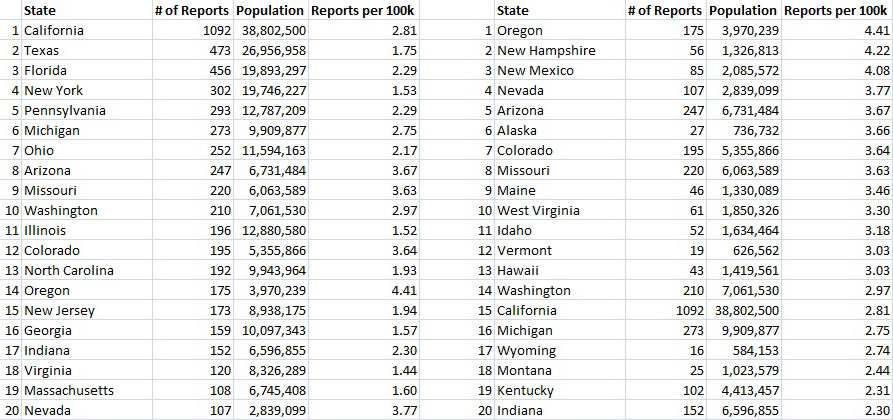
I downloaded the data from Kaggle that the Data Duo used to pour it up with population data to see where the real hotspots are. Essentially I just divided the number of sightings by the number of people in each state. You can see the places that have more sightings per person are very different that the ones with the most sightings.

It is important to read the data right. If you were looking to have a UFO experience, and you go to the area with the most reports, you could be lowering your odds. The odds are better if you go to a place having more sightings per person. Or maybe you want to be far away from UFOs, and you think you are going to a state like New Hampshire, which has very few sightings. However, New Hampshire has a lot of UFO sighting per person, so you may inadvertently have ended up smack dab in the middle of UFO country.
Even though I think the Bustle article is relying way to much on the number of sightings instead of the sightings per person, it is still an article I recommend you read. It has some interesting speculation on where aliens might visit if they were to visit Earth, or why they might be visiting the places they may be buzzing around right now.