We recently wrote about an interactive UFO map that was created by a data scientists. Now a software company specializing in enterprise risk visualization has put together some great maps analyzing UFO sightings, including data such as what is seen when and where.
IDV Solutions posted the maps on their UXBlog where they post various data visualization examples. Some of them, including their UFO maps, are quite stunning.
The data they used, much like the data scientists with the interactive maps, uses data retrieved from the National UFO Reporting Center (NUFORC).
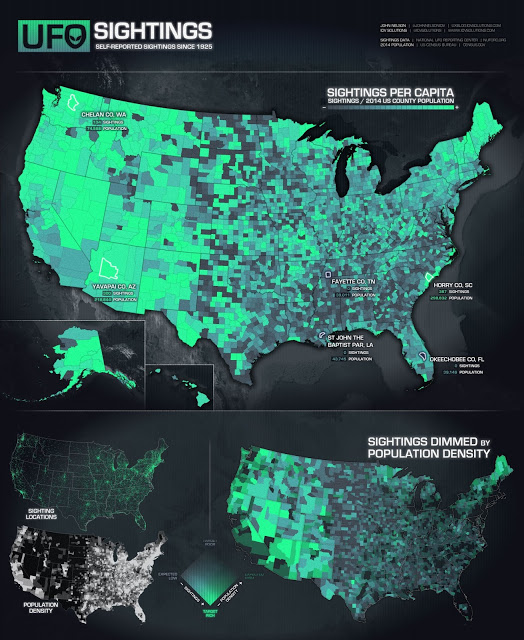
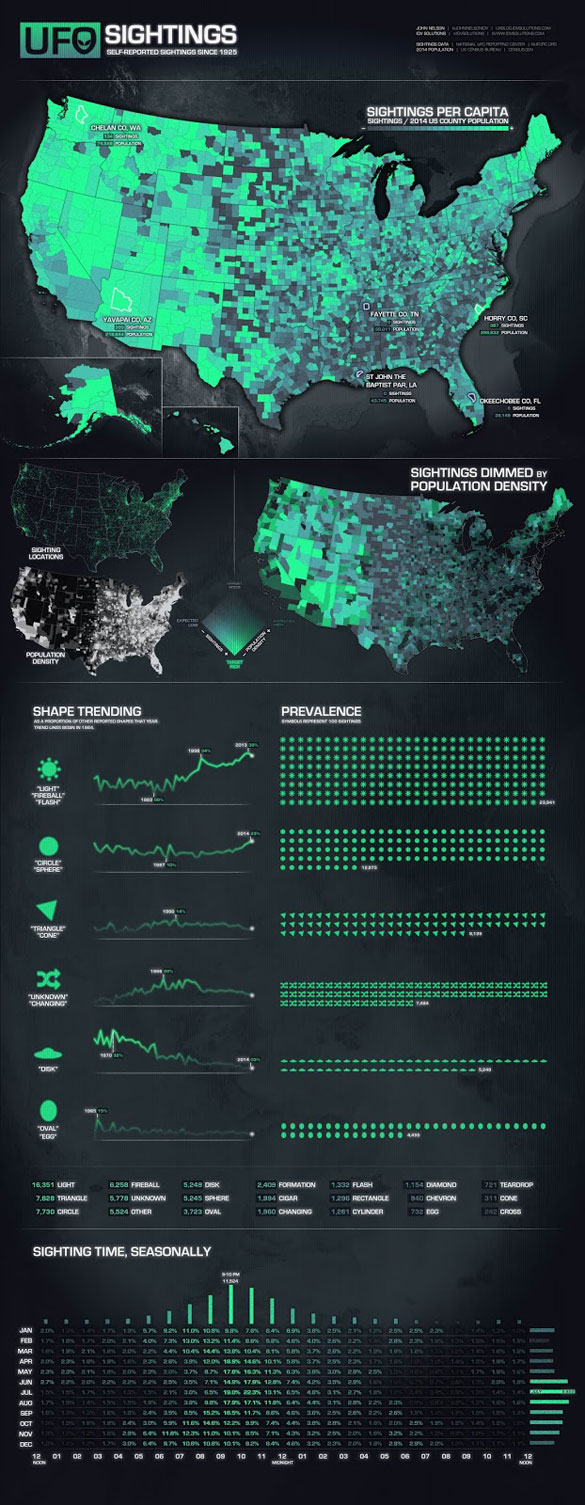
The first of their maps shows the sightings per capita. In other words, how many UFO sightings reported per person. The makers note, “Of course, as is the case for any observation data, there is a strong tendency towards echoing a population map.”
That is whty they felt it would be more accurate to display the sighting per capita to find out where there are more reports compared to the population. Like other maps have found, including our own Open Minds maps we produce at the beginning of each year, they find UFO sightings are more frequent per person in the west.
The Huffington Post UK took a stab at speculating why there are more sightings in this area. They wrote, verbatim: “Well it’d be foolish not to mention the fact that much of the US Military’s weapons and experimental aircraft testing takes place in the Nevada desert, found rather conveniently in the west United States.”
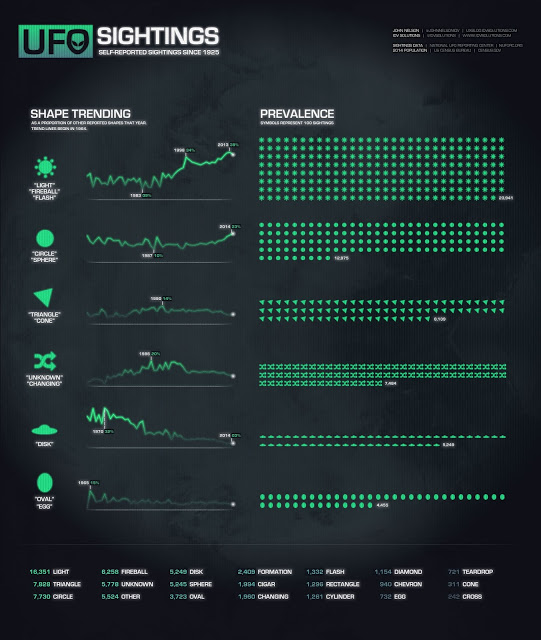
The map also shows trends for the type of craft that are often reported. Interestingly, they found the most popular type of object is what they list as a light, fireball, or a flash. They also show how this type of report has increased over the year.
Also very interesting, is that your cliché UFO “disk” sighting has greatly decreased over the years.
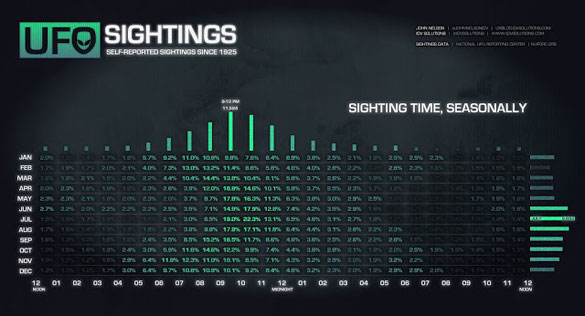
The map also analyzes the time of year and time of day UFO sightings take place. It appears most sightings happen between 9 and 10 pm, and the busiest time of the year for UFO reports is July.
It is great to see so many mainstream companies getting involved in UFO analyses. Does this trend indicate that the topic is being accepted more widely by the general public? Perhaps. Either way, it is great to get these maps because they help us learn a lot about the phenomenon, and the media loves them, so they also get the word out.